The original design intention of Session Guard Desktop is: due to large differences in profile usage factors (proxy information, browser fingerprints, egress IPs, devices, local networks, etc.), website login states become unstable – especially for Google ecosystem platforms (Gemini, notebooklm) which frequently log out. Session Guard Desktop automatically inspects the login status of DICloak browser profiles, and attempts to restore the login when it detects that the session has been lost. This is a local project, and all credential information will be stored on your device. No important credentials will be leaked, so please use it with confidence.
It is suitable for scenarios where:
- You need to maintain login states for many DICloak profiles over a long period.
- You want to reduce manual checks for account disconnections.
Note: Because this app requires DICloak’s open API functionality, you need to upgrade to the Plus or Share+ plan to use this feature.
Preparation before use
Before you begin, please make sure the following are ready:
- DICloak installed and opened
- DICloak Local API enabled
- Session Guard Desktop installed and opened
- The DICloak profile name and profile number to be inspected are known
- The corresponding site account and password are ready
Step 1: Complete Session Guard settings
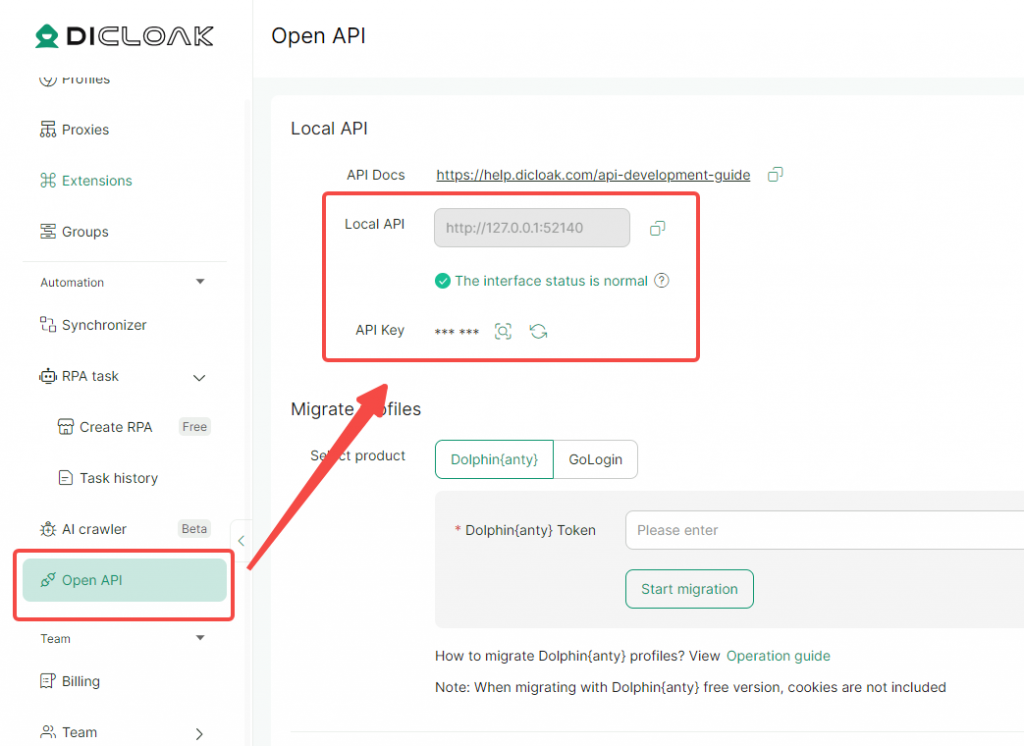
- Open DICloak, go to Open API in the left navigation bar to obtain the Local API base URL and API key.
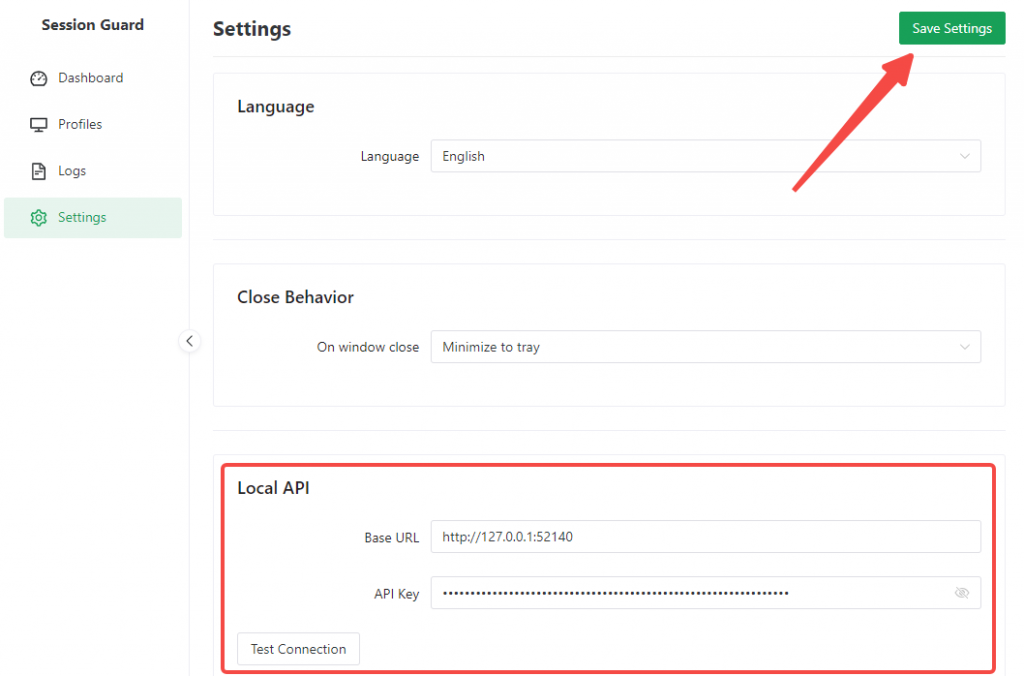
- After opening Session Guard Desktop, first go to Settings in the left menu.
- Focus on confirming these two items:
- API base URL: Fill in the DICloak Local API base URL, usually
http://127.0.0.1:port - API Key: Fill in the DICloak Local API key
- API base URL: Fill in the DICloak Local API base URL, usually
- Then operate in the following order:
- Fill in the API base URL
- Fill in the API key
- Click Test Connection
- After successful connection, click Save Settings in the upper right corner
- Focus on confirming these two items:
Explanation:
- Other parameters can usually be left as default.
- If the Local API port of DICloak changes later, just come back here to modify it.
Step 2: Create a new profile configuration
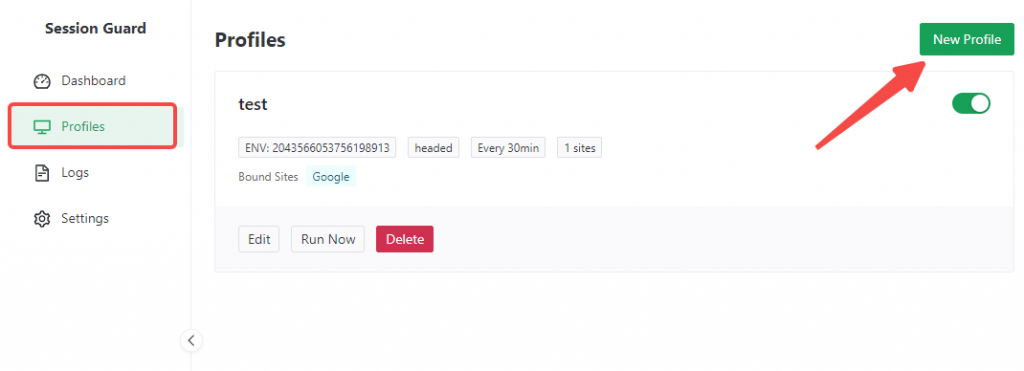
Go to Profiles in the left menu, then click New Profile in the upper right corner.
2.1 Fill in basic information
Fill in the following:
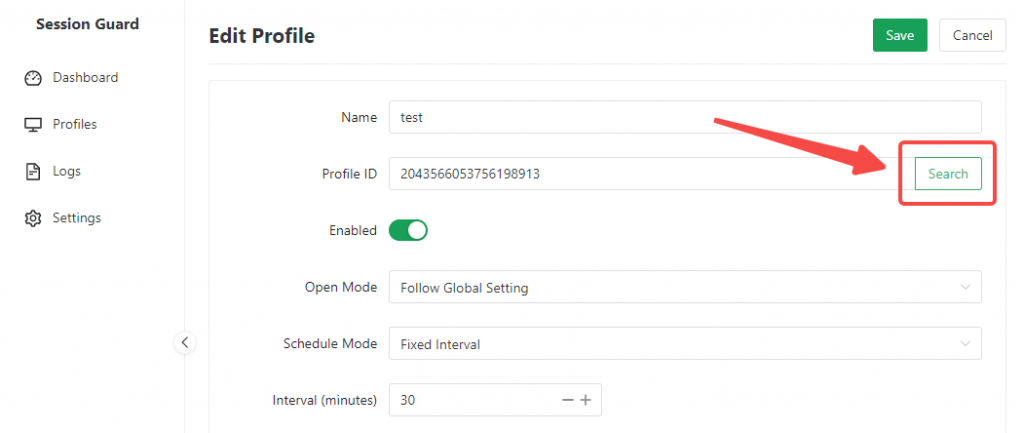
- Profile Name: Suggest a recognizable name, e.g., “Google Main Account”
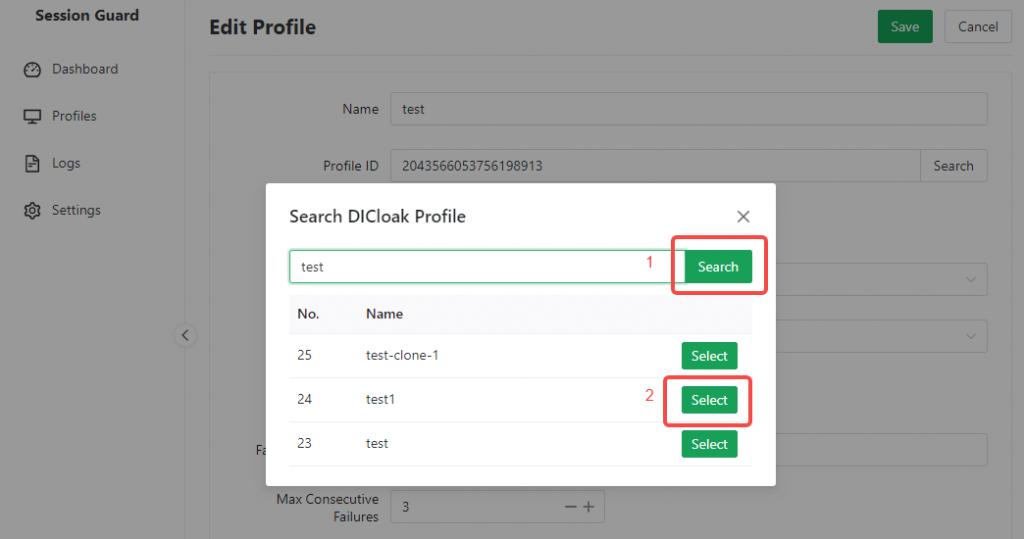
- Profile ID: Click Search Profile to the right of the Profile ID field, search by the DICloak profile name (if there are profiles with the same name, use the number to differentiate), and the Profile ID will be auto-filled after selection.
- Enabled: Keep “Enabled”.
2.2 Choose execution mode
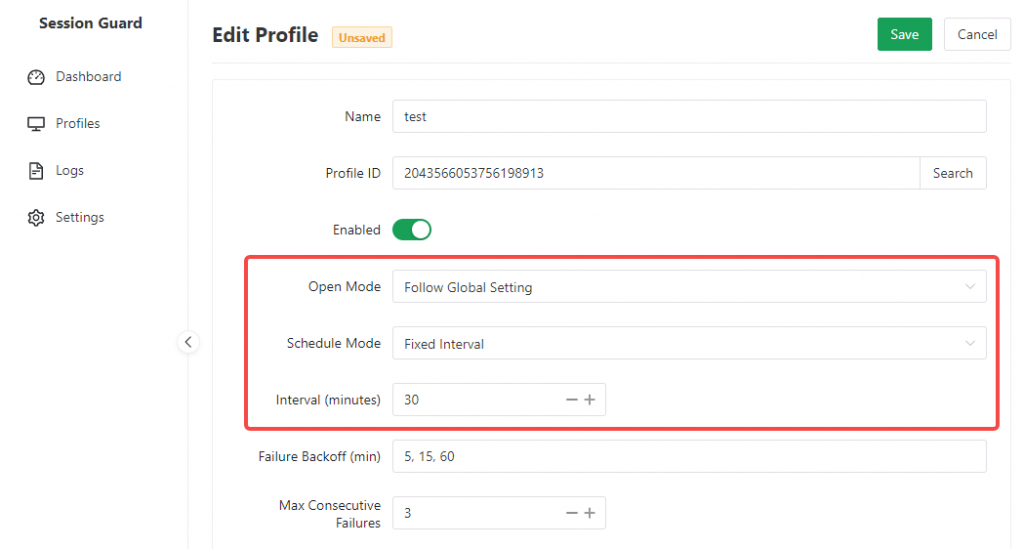
For first-time use, it is recommended to use the following defaults:
- Open Mode: Follow global settings, or directly select “Headed” (headless mode is not supported for now)
- Scheduling Mode: Fixed interval
- Interval (minutes): Recommended ‘30’
2.3 Select sites to inspect
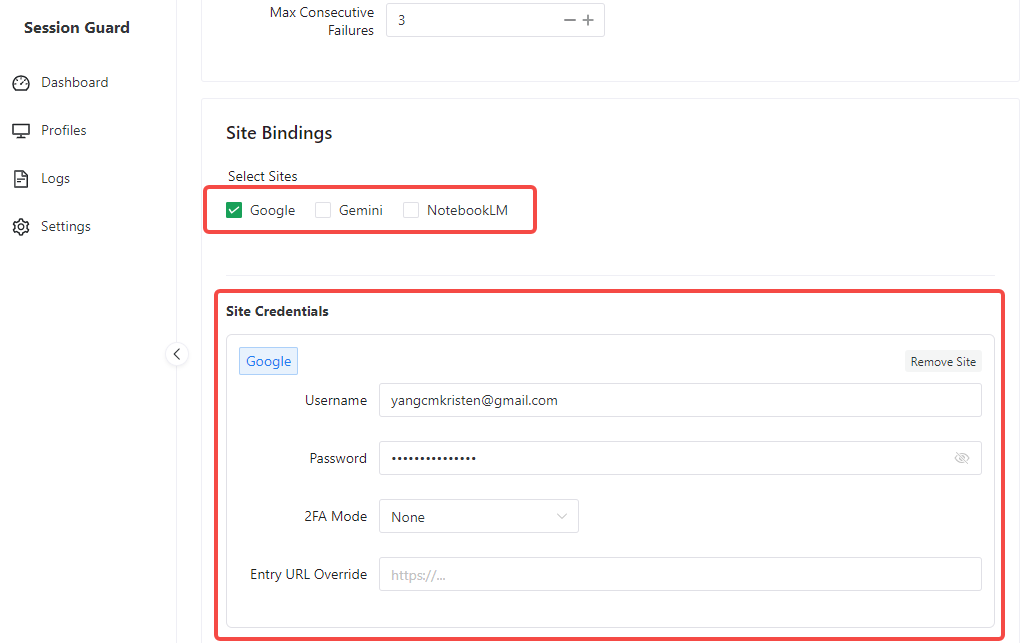
In the Site Bindings area, check the sites you wish to inspect.
For each site, fill in the corresponding credentials:
- Username
- Password
- 2FA Mode: If no special requirement, keep “None”
- Entry URL Override: Usually leave empty
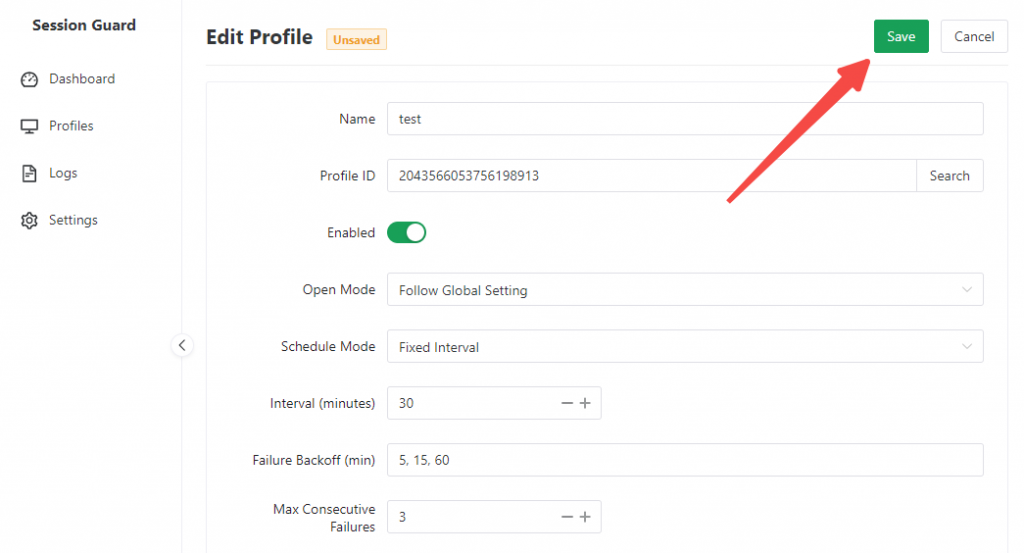
After filling, click Save.
Suggestion:
- For first use, check only one site.
- First verify each profile with a minimal configuration before adding more sites.
Step 3: Execute once immediately to confirm the configuration is correct
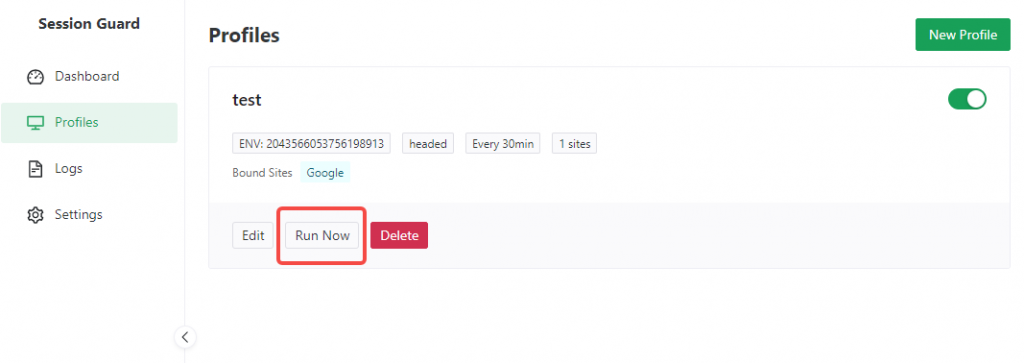
After saving the profile, return to the Profiles page.
You will see each profile card showing:
- Profile ID
- Open mode
- Scheduling method
- Bound site tags
Click “Execute Now” on the corresponding profile to manually trigger an inspection.
If the configuration is correct, you will typically see one of the following results:
- Login successful
- Login restored
- Login failed
- Exception
It is strongly recommended that after initial configuration, you manually execute once instead of relying directly on automatic scheduling.
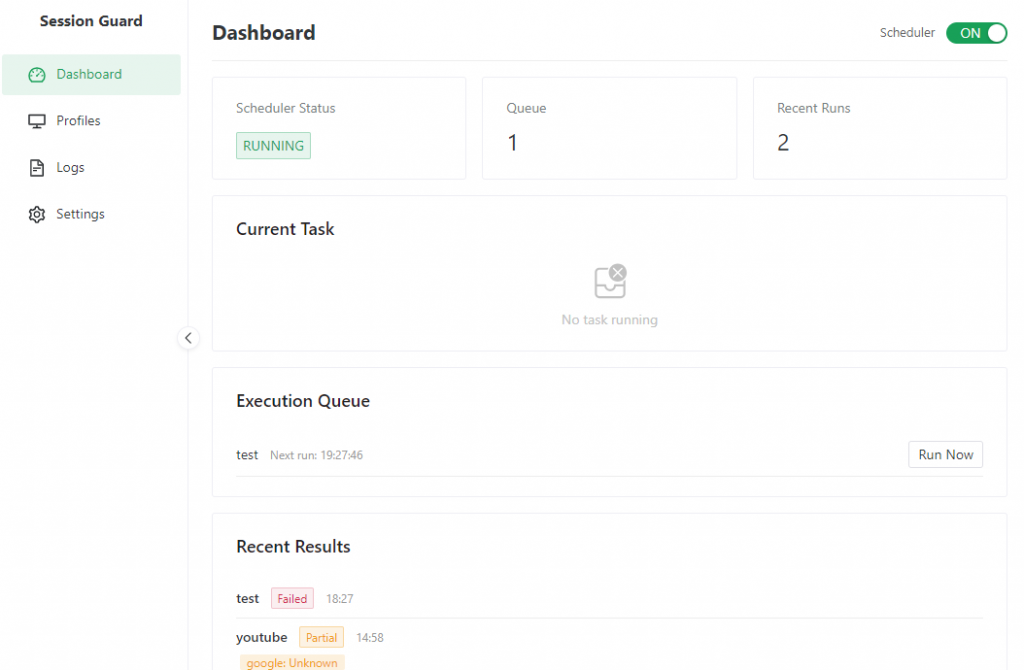
Step 4: View execution results on the dashboard
Go to Dashboard in the left menu to see the overall operational status.
The most useful areas here are:
- Scheduler Status: Whether it is currently running
- Execution Queue: Profiles pending execution
- Recent Results: The most recent execution result
For first-time use, just focus on Recent Results.
Meanings of common results:
- All Successful: All inspected sites for this run are normal
- Partial Failure: Some sites have issues
- Execution Failed: The task did not complete successfully
- Skipped: The profile is not suitable for execution at this time (e.g., the profile is opening or is occupied and cannot be opened)
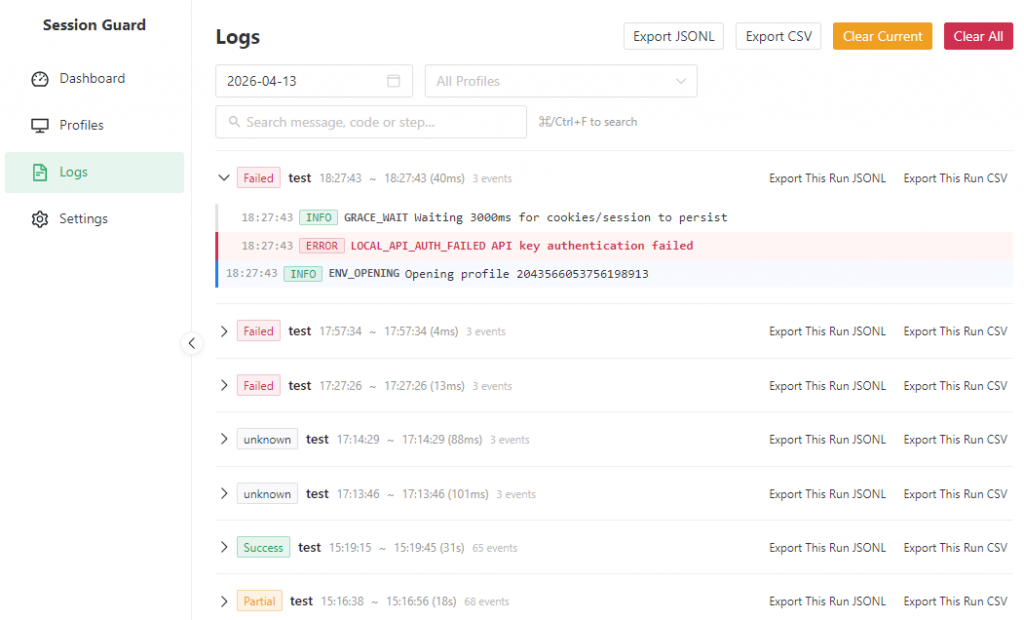
Step 5: View detailed logs
If an execution result is abnormal, go to Execution Log in the left menu for details.
The Execution Log page supports:
- View by date
- Filter by profile
- Search by keyword
- Export logs
If you need to report an issue to technical support, it is recommended to provide:
- The name of the problematic profile
- The time the issue occurred
- Screenshots of the corresponding logs
- Exported logs
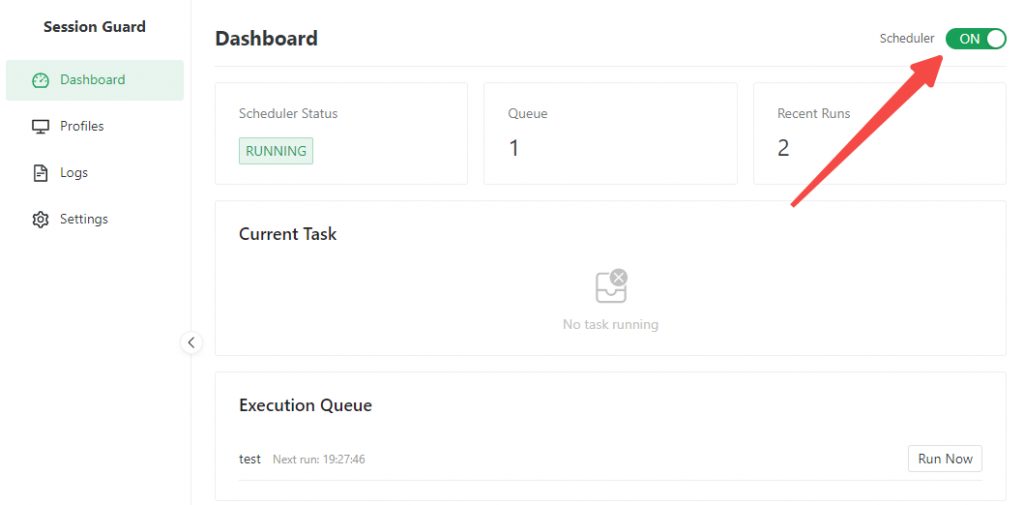
Step 6: Enable automatic inspection
Once you have completed a manual verification and confirmed the result is normal, you can enable automatic inspection.
Go to the Dashboard and turn on the scheduler switch in the upper right corner.
After enabling, the system will automatically execute according to the scheduling rules configured for each profile.
Recommendations:
- Initially operate with a small number of profiles in a trial run.
- After observing for 1–2 days, gradually expand to additional profiles.
Frequently Asked Questions
1. What should be done if the Local API test connection fails?
Priority should be given to checking the following:
- Whether DICloak is running.
- Whether the Local API feature is enabled.
- Whether the API base URL is entered correctly.
- Whether the API key is entered correctly.
2. What is the difference between headed mode and headless mode? Why is headed mode recommended initially?
Headed mode launches a complete browser interface (a visible window), facilitating debugging and observation of operations. Headless mode runs in the background without displaying any interface. During the initial configuration phase, headful mode allows easier observation of whether pages open successfully and whether the correct page redirection occurs, and simplifies identification of login failure causes. Therefore, headless mode is not recommended for initial setup.
3. Why does a profile save successfully but execution fail?
Common causes include:
- Incorrect site account or password.
- Incorrect DICloak Local API base URL or API key.
- The current profile is already open or cannot be opened.
The execution logs may be consulted to identify the cause of failure. If questions remain, please send the problematic profile name and corresponding log screenshots to technical personnel.
4. Where are site credentials stored?
Desktop credentials are stored locally and encrypted. Under normal usage scenarios, re-entry is not required for each operation.
5. After re-login, why do members still appear logged out?
Verify whether members and Session Guard are using the same profile simultaneously. If so, cloud login data may not be successfully synchronized. It is recommended to disable the “Multi-open mode” feature within DICloak’s global settings or avoid peak usage periods when inspecting login status.